Where to locate deportation data and how to compare different years
- Factchequeado

- Feb 24
- 5 min read
Comparing deportation data requires historical context, understanding of methodological changes, and transparency about the limitations of the available data.
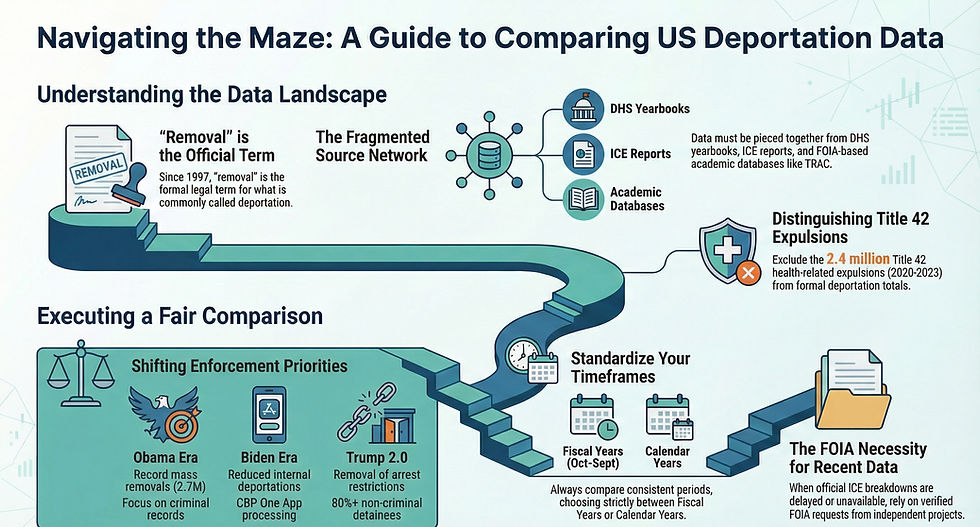
There is no single source; multiple sources and official data obtained through the Freedom of Information Act (FOIA) must be analyzed, along with data compiled by academic or non-profit organizations.
Step 1: Understand the main challenge
Deportation data is not available in a single repository, making any comparative analysis very difficult. The measurement criteria have changed between administrations; information is scattered across multiple sources; and, in the last administration of President Donald Trump, deportation statistics were not updated. There is data up to December 2024 on official sites.
Step 2: Identify the main official sources
Government sources:
● Department of Homeland Security (DHS): publishes statistical yearbooks on immigration, but with significant delays.
● Immigration and Customs Enforcement (ICE) has annual reports through December 2024; for more recent data from Trump's second term, there are no official public figures broken down, and we have to resort to other sources that we will explain later.
● U.S. Customs and Border Protection (CBP): Has data on encounters and expedited expulsions.
Academic and independent sources:
● Deportation Data Project: Obtains data through FOIA (Freedom of Information Act) requests when agencies fail to release information.
● Syracuse University's TRAC (Transactional Records Access Clearinghouse) has a consolidated historical database.
Step 3: Understand official terminology
The term "deportation" is not used in current government statistical compendia. Until 1997, U.S. immigration law formally used "deportation" as a legal term; with the Illegal Immigration Reform and Immigrant Responsibility Act (IIRIRA) of 1996, several processes were consolidated under the term "removal." The term deportation still appears in laws and official documents, especially in historical contexts.
The technical-legal term is "removal" (removals; see DHS dictionary), although "deportation" continues to be used and understood, even in official contexts." The removals in the official statistics, then, are the deportations.
Other terms to be distinguished:
● Returns: Informal expulsions without judicial process.
● Title 42 Expulsions: Expedited expulsions on health grounds (March 2020-May 2023), which are not considered formal deportations.
Step 4: The Problem of Comparing Different Periods
Here is the big challenge: registration criteria can change from administration to administration, making comparisons complex. When they are re-elected, evaluate them separately every 4 years.
Some of the key changes and important events about deportations during the administrations were:
Obama era (2009-2017):
● Prioritizing the deportation of people with criminal records, especially in the second term, after he was called "the deporter-in-chief."
● Implementation of the Secure Communities program, through which digital fingerprints were shared between local police, the FBI, and ICE.
● Record mass deportations: 2.7 million in 8 years.
Trump era (first term 2017-2021):
● Elimination of priority categories: any undocumented person was deportable.
● "Remain in Mexico" program for asylum seekers.
● Use of Title 42 since March 2020.
Biden era (2021-2025):
● Reduction of internal deportations in non-border states.
● CBP One Application to Process Asylum
● Maintenance of Title 42 for part of the term.
● The figures for its last fiscal year show a high monthly average.
Trump 2.0 era (2025-present):
● Data obtained via FOIA from the Deportation Data Project.
● Removal of restrictions on arrests in schools, churches, and hospitals.
● More than 80% of detainees were without a criminal record in the first months.
Step 5: Access recent data, after 2024
For Trump's second term (since the beginning of 2025), ICE has not published official figures broken down by category.
The available data comes from:
FOIA requests are processed by organizations such as the Deportation Data Project.
Media analysis that collects partial data.
Official DHS statements, most often without a breakdown or details.
Step 6: How to make balanced comparisons?
Factors to consider:
- Daily averages vs. annual totals: Obama recorded peaks of more than 1,000 deportations per day in his first term and remained so for the first 4 years. If compared to Trump 2.0, there will be days equal to those times, but with a different profile of detainees and deportees.
If you compare by year, the first Obama administration is still the highest point. Still, the pace of deportations with Trump in 2025 is close to those levels and clearly exceeds the last years of Obama and the entire Biden period.
- Temporal consistency: avoid comparing fiscal years vs. full calendar years vs. first months of an administration vs. entire administrations. Either one or the other is chosen, but a unique time frame should be set for each period to ensure a fair and accurate comparison. Fiscal Year (FY) begins on October 1 and ends on September 30; The calendar year is the standard calendar year that runs from January to December. The changes of mandate occur on January 20 or 21.
- Exclude Title 42: Between 2020 and 2023, there were 2.4 million expulsions under this measure (implemented at the beginning of the COVID-19 pandemic), and they are not considered formal deportations.
- Recidivism rate: Formal deportations (removals) have greater legal weight than simple returns (returns). "Removals" (a government technical term for deportation) have re-entry prohibition consequences ranging from 5, 10, or 20 years, or even permanently; it is recorded in the DHS system; If the person re-enters without documents after a removal, it is a federal felony and carries criminal consequences; You will have little chance of obtaining a visa in the future. In simple returns, they are not formal deportation orders; the person signs a "voluntary departure," and the consequences are minor: there is no automatic legal prohibition of re-entry, and a criminal record is not generated, but an administrative one. Since 2006, single returns have been used only rarely.
Recommendation: make your comparisons and analyses in a spreadsheet. There, you can throw in the data, dates, time periods, and the source from which you extracted that information.
Step 7: Limitations to Consider
When presenting your findings, always mention:
● Lack of a single, up-to-date repository.
● Delays in the publication of official data or non-existent data.
● Methodological changes between administrations.
● Incomplete or missing data for specific periods.
● Differences between fiscal years (October-September) and calendar years.
● The methodological criteria you defined to compare the data.
● The sources consulted.
Note: Compare your findings with those of other credible media and organizations to see if there are any major discrepancies with your research and reading. This helps you verify your own data.
Example of writing a conclusion after comparing:
Instead of saying: "Trump deports more than Obama" or "Obama deported more than Trump", it is necessary to specify:
"During his first term (2009-2013), Obama averaged more than 1,000 deportations a day, with greater emphasis on people with criminal records. In contrast, Trump, in his second term (2025-present), shows variable monthly averages that do not distinguish between categories of deportees, making direct comparisons of policy impacts difficult. Even so, according to available data, in Trump's second term, there have been days with an average of more than 1,000 deportations.
Resources:
Government:
DHS yearbooks (current only through fiscal year 2024) and ICE statistics, where detentions and deportations are compiled.
CBP (Customs and Border Protection): Data on border encounters, monthly statistics.
USCIS (U.S. Citizenship and Immigration Services): Data on visas, petitions, and naturalizations.
DOJ EOIR (Executive Office for Immigration Review): Statistics on immigration courts and pending cases.
GAO (Government Accountability Office): Audit reports on migration policy.
Data from government agencies obtained by FOIA:
TRAC Immigration: Syracuse University project since 1989.
Means of verification:
PolitiFact.
Non-profit organizations:
American Immigration Council, among others.


Comments